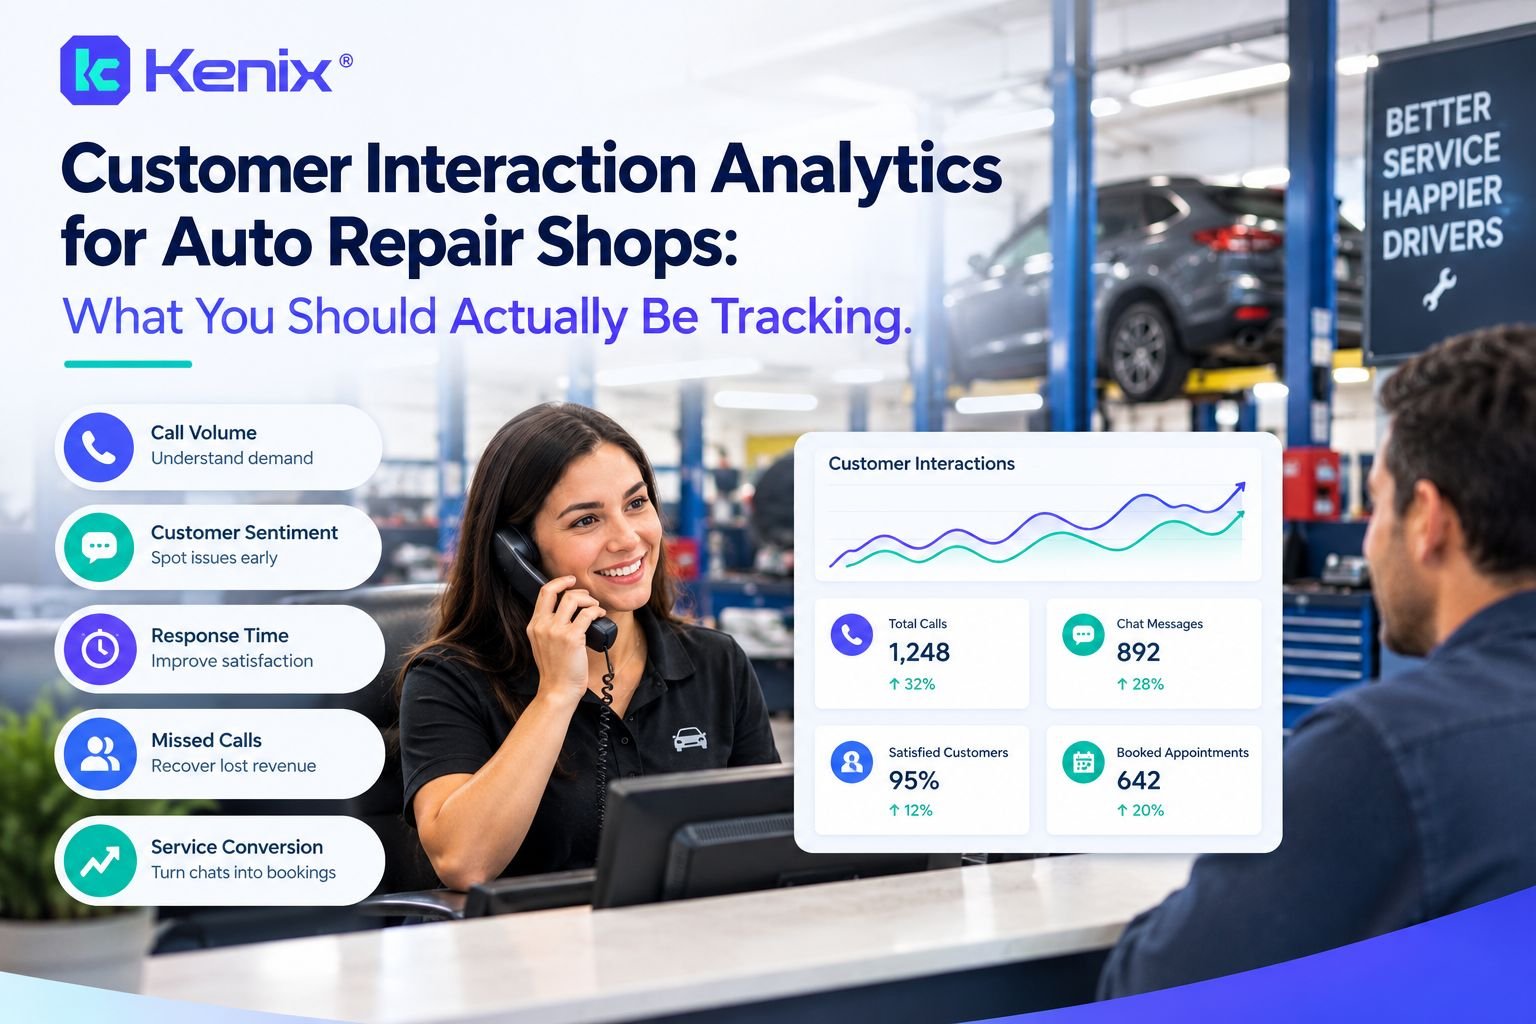
Customer Interaction Analytics for Auto Repair Shops: What You Should Actually Be Tracking
I have sufficient data from the outline’s research notes plus the search results to write the article. The key statistics are well-documented. Let me proceed.
Most shop owners track call volume. Some track ARO and parts margin. Very few track what actually determines whether a ringing phone turns into booked revenue — the quality and outcome of every customer interaction on those calls.
According to data from automotive CRM research, shops lose an estimated 20–30% of inbound opportunities not because the phone doesn’t ring, but because what happens on those calls is never analyzed. The intelligence is there. Most shops just aren’t extracting it.
Why Call Volume Is the Wrong Number to Watch
Call volume is a vanity metric. It measures how busy your phone is — not whether your business is growing.
A shop fielding 200 calls a month but converting 30% of them is leaving far more money on the table than a shop taking 100 calls and converting 70%. The number that matters is what happens after the phone rings. Yet most shops’ “analytics” begins and ends with a call log showing answered versus missed.
Customer interaction analytics is a different category of intelligence. It sits above basic call logs and analyzes what was said, whether it converted, why it didn’t, and how the staff member performed. According to Marchex automotive data, up to 21% of auto service customer calls go unanswered — but that figure only captures the easy problem. The harder problem is the calls that get answered and still don’t convert, for reasons no one ever reviews.
The rest of this guide covers five specific data points every shop should be pulling from its calls — and most shops are capturing zero of them.
Metric #1: Call-to-Booked Appointment Conversion Rate
This is the foundational metric. Of every inbound call that reaches a staff member (or an AI system), what percentage results in a confirmed appointment?
Shops that measure this for the first time are often surprised. Conversion rates on manually handled calls during peak hours frequently fall below 50% — advisors are juggling the floor, the phone, and active repair orders simultaneously. The result is rushed calls where no one actually asks for the appointment.
A flat answered/missed log doesn’t capture this. What you need is call-level outcome tagging: booked, not booked — caller will call back, not booked — price objection, not booked — no availability offered, not booked — advisor didn’t ask. Each tag tells a different operational story. “Caller will call back” is usually a lost appointment. “No availability offered” is a scheduling problem, not a sales problem. Without that distinction, you’re optimizing blindly.
The benchmark to target: a well-trained shop with consistent follow-up and AI-assisted booking support should be converting 70%+ of answered calls. If you don’t know your current number, finding out is the first step.
Metric #2: Reasons Callers Don’t Book
If call-to-booking conversion rate is the “what,” abandonment tagging is the “why” — and it’s the single most underused data point in auto repair analytics.
The most common non-booking reasons worth tracking:
- Price objection on a quoted service (signals a value presentation or competitive pricing issue)
- No available slot offered (signals a scheduling or capacity problem)
- Caller not ready — just comparing prices (signals a nurture or follow-up gap)
- Advisor didn’t ask for the appointment (signals a training gap, pure and simple)
- Service not offered (signals a menu or referral gap)
Each reason demands a different response. A pattern of price objections means coaching advisors on communicating value, not restructuring your schedule. A pattern of “no availability shown” means the problem lives in your booking system, not your sales skills. Conflating the two means fixing the wrong thing.
The challenge is that manual self-reporting by advisors introduces significant bias. No one reliably flags their own failures. AI-powered call analysis that automatically categorizes non-conversion reasons produces clean, consistent data — the same standard applied to every call, every time.
As Sandra Chen of Precision Auto Care in Houston put it after implementing Kenix’s AI Analysis: “We can see exactly where approvals are being lost on calls. It’s like having a trainer in the shop full time.”
Metric #3: Most Requested Services by Call Topic
Your inbound calls are a direct read on what customers want from your shop. That data is almost always more accurate than your own assumptions about what your market needs.
Service topic categorization — tagging calls by what service the customer was asking about (oil change, brakes, AC, transmission, alignment, check engine light) and tracking frequency over time — reveals two things most shops would never discover otherwise.
First, it surfaces the gap between what you promote and what customers are calling about. If 35–40% of your inbound calls over a 90-day period involve a service you don’t prominently advertise or staff for, that’s not random noise — it’s evidence of latent demand you’re not capturing.
Second, it sharpens your marketing calendar. If call topic data shows AC inquiries climbing in April every year, the right time to run AC service promotions is March — not because a calendar template told you so, but because your own call data confirmed the demand pattern. That’s a meaningful difference between guessing and knowing.
This data also connects directly to your ad spend. If a Google Ads campaign is driving tire-related calls that convert at 25% while organic brake inquiries convert at 65%, the analytics is telling you where to reallocate budget — and pointing toward the question worth investigating (why are tire callers not converting?). Linking call topic frequency to marketing attribution and ROI gives you that full picture.
Metric #4: Staff Performance Scores on Manually Handled Calls
Even the most automated shop still has calls that require a human: complex diagnostics questions, upset customers, fleet account relationships. How those calls are handled is measurable, and most shops don’t measure it at all.
Per-advisor call scoring tracks specific behaviors on each call:
- Did the advisor ask for the appointment?
- Did they handle a price objection, or deflect it?
- Did they offer an alternative date when the first slot was unavailable?
- Did they mention an active promotion?
- Did they close the call with a confirmed next step?
This is the same principle as a mystery-shopper program — but automated, continuous, and objective. No manager has to spend hours listening to recordings. No advisor gets flagged inconsistently because a manager reviewed three of their calls on a bad day and twelve on a good one.
When Kenix surfaced call data for Daniel Rivera at Rivera Body Works in Miami, it revealed his team was missing approximately 30 calls a week — losses the shop had no visibility into. In the first month after addressing those gaps, Rivera recovered over $14,000 in jobs. The phone was ringing. The money was there. The data just wasn’t.
Individual advisor benchmarking — comparing each staff member against their own history and against each other — creates accountability without arbitrariness. Advisors can see their own trends. Managers can have specific, evidence-based coaching conversations instead of general performance reviews.
How Call Data Informs Marketing Spend and Your Service Menu
Once you’re tracking conversion rate by call topic, you have a map of where your marketing dollars are over- or under-allocated.
The logic is straightforward. If your Google Ads drive 60 tire-related calls per month but those calls convert at 25%, while brake calls from organic search convert at 65%, that performance gap is worth investigating. It might be a pricing issue, a competitor pricing issue, or a front-desk training issue specific to tire conversations. But you won’t ask the question if you don’t see the data first.
On the service menu side: aggregate call topic data over 90 days will regularly surface service requests your shop doesn’t actively promote or offer. Whether you expand your service menu, build a referral relationship, or simply start marketing existing services more prominently is a business judgment — but the data removes the guesswork about whether demand exists.
| What the Data Shows | What to Consider |
| High call volume for a service, low conversion | Price, availability, or advisor training issue |
| High call volume for a service you don’t offer | Menu expansion or referral opportunity |
| Specific advisor consistently lower conversion | Targeted coaching on specific call behaviors |
| Seasonal spike in a service topic | Front-load marketing spend 4–6 weeks earlier |
The prerequisite for any of this is a platform where call topic and conversion outcome can be cross-referenced — not viewed as separate reports that you manually reconcile. Call data that lives in a silo, separate from your CRM and calendar, degrades in usefulness quickly.
Closing the Loop: Turning Call Data Into a Front-Desk Training System
The most practical thing customer interaction analytics can do isn’t produce reports — it’s generate a specific, continuous training program for whoever answers the phone.
A structured feedback loop looks like this: weekly review of your lowest-converting call categories, identification of two or three specific advisor behaviors that correlate with non-conversion, a focused coaching session built around those exact call moments, and re-measurement the following week. Repeat. That cadence — specific behavior, specific evidence, specific measurement — is what separates meaningful training from generic customer service workshops.
According to CRM benchmark data from Vida.io, shops that implement systematic training workflows tied to customer interaction data report retention improvements of 15–25% within the first year. The key word is “systematic.” The improvements don’t come from a one-time training event — they come from a repeatable loop where call data continuously feeds coaching decisions.
For most shops, the obstacle isn’t willingness to train — it’s bandwidth. A service manager running 15 techs and handling 150 calls a week doesn’t have time to audit recordings. AI-powered call analysis solves this by automatically surfacing the specific call moments worth reviewing, generating advisor performance summaries, and flagging coaching priorities — without requiring anyone to manually process raw recordings.
That’s what makes the feedback loop operational rather than aspirational. You can explore how Kenix’s AI Analysis module handles this end-to-end, from call scoring to coaching-ready summaries.
What to Look for When Evaluating a Customer Interaction Analytics Platform
Not all call analytics tools are built the same. Here’s what separates a genuine analytics platform from a call log with extra steps:
Call-to-booking conversion tracking — not just answered vs. missed. The platform must distinguish between a call that was answered and one that actually resulted in a booked appointment, with outcome tagging at the call level.
Automated non-booking reason categorization — manual self-reporting by advisors produces unreliable data. The standard should be AI-automated tagging, applied consistently to every call.
Service topic categorization — searchable, aggregate tagging by service type across all inbound calls, queryable over custom date ranges.
Per-advisor performance scoring — individual benchmarks against both their own history and the shop’s aggregate, not just shop-wide averages that mask individual performance gaps.
Unified data architecture — call analytics that lives separately from your CRM and scheduling system forces manual reconciliation that degrades over time. When VoIP, CRM, AI analysis, and calendar share a single data layer, every call automatically becomes a CRM record, a calendar event, and a coaching data point without any manual input.
On pricing: fragmented stacks (standalone VoIP at ~149/mo,CRMat~199/mo, AI call analysis at ~299/mo,schedulingat~149/mo) typically land north of $1,000/month once assembled. Kenix consolidates all five systems — including AI Analysis — starting from $499/month.
Frequently Asked Questions
What’s the difference between call tracking and customer interaction analytics?
Call tracking records which calls came in and identifies the source — which ad, which keyword drove the call. Customer interaction analytics goes deeper: it analyzes what was said, whether the call converted, why it didn’t, and how the staff member performed. Call tracking is a marketing attribution tool. Customer interaction analytics is a revenue and training tool. Both have value; they solve different problems.
Do I need to listen to every call myself to get value from call analytics?
No — and that’s exactly what AI-powered analytics is designed to solve. The platform listens, transcribes, scores, and categorizes every call automatically. What reaches you is a prioritized list of calls worth reviewing, a set of aggregate performance metrics, and coaching-ready summaries. Not hours of raw recordings.
How do I know if my call conversion rate is good or bad?
Shops measuring this for the first time typically find conversion rates between 40–60% on manually handled calls during peak hours. A well-optimized shop with consistent advisor training and AI-assisted follow-up should be targeting 70%+. The benchmark matters less than the trend — continuous quarter-over-quarter improvement is the goal.
Can call analytics tell me which services to add to my menu?
Indirectly, yes. If 90-day call topic data shows consistent inquiry volume for services you don’t currently promote or offer, that’s evidence of latent demand. Whether to add the service, refer it out, or simply market an existing capability more aggressively is a separate business decision — but the data removes the guesswork about whether demand actually exists.
What’s the difference between Kenix and a standalone call tracking tool?
Standalone call tracking tools record and attribute calls but typically don’t score advisor performance, tag non-booking reasons automatically, or connect call outcomes to your CRM and calendar. Kenix’s AI Analysis is one module within a unified platform — call data automatically feeds CRM records, calendar bookings, and coaching insights without manual reconciliation across separate systems.
Conclusion
Tracking call volume alone is the auto repair equivalent of tracking website traffic without ever looking at conversion rate — it feels like data, but it doesn’t tell you what to do differently.
The shops pulling ahead in 2026 treat every call as a dataset: conversion rates, topic trends, abandonment reasons, and advisor scores feeding specific decisions about marketing spend, service offerings, and front-desk training. That kind of intelligence doesn’t require a dedicated analytics manager — it requires a platform built to surface it automatically. That’s the case for customer interaction analytics, and it’s where the real operational leverage lives.
Back to the previous article